HomeWriting
The graphs below show the cinema attendance in Australia and the average cinema visits by different age groups from 1996 to 2000
2024-07-29
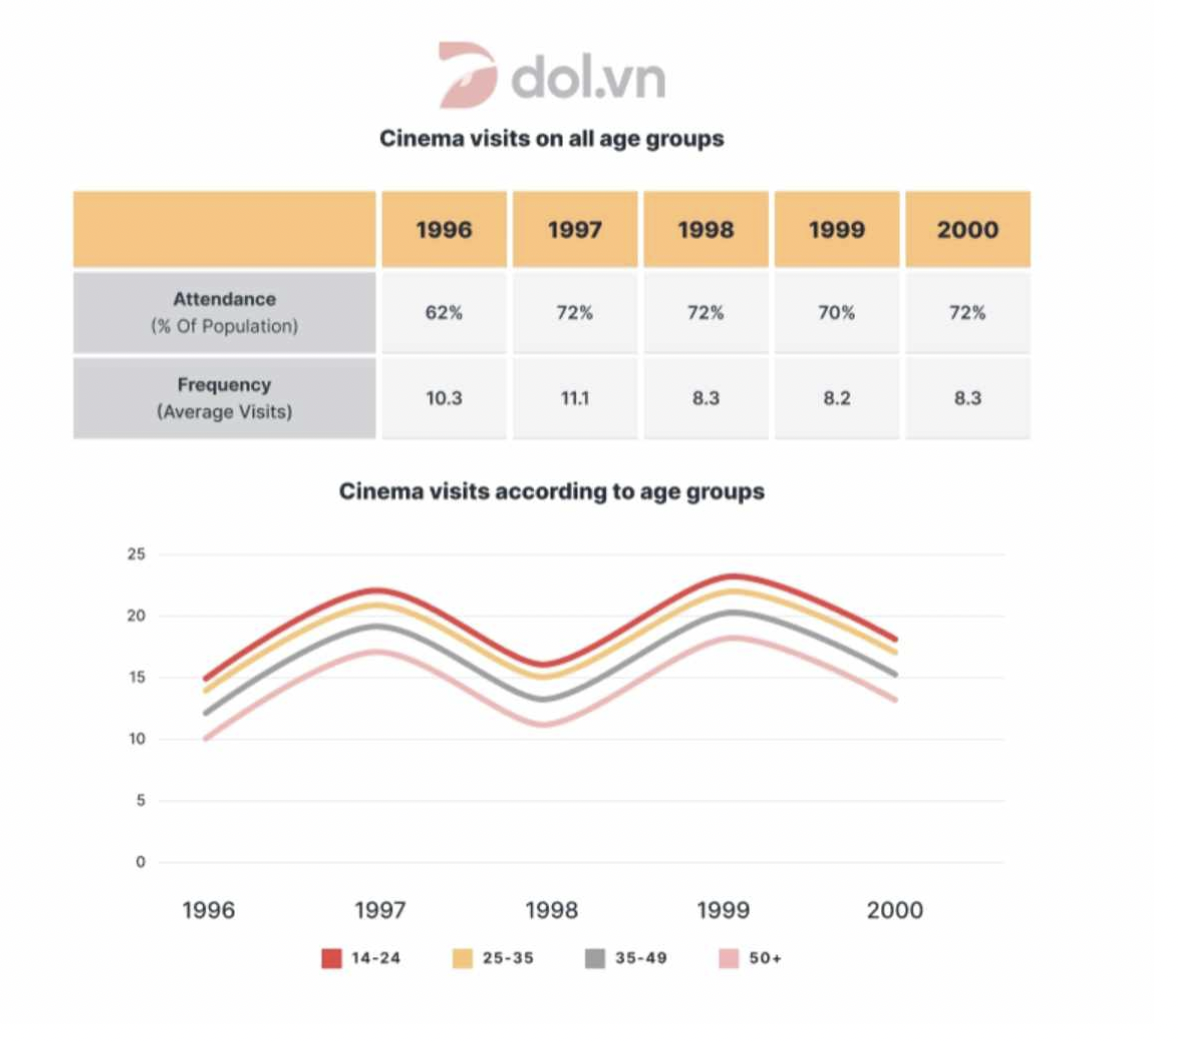
The provided table depicts/delineates/illustrates the percentage of Australian cinema attendance and its frequency from 1996 to 2000 and a line graph comparing cinemagoers across various age brackets during the same timeframe.
Overall, it is evident that there was an increase in the proportion of cinema attendance, while the frequency of cinema visits in Australia witnessed a decline over the specified period. Notably, the trend and fluctuations in cinema attendance were consistent across different age groups.
Regarding Australian individuals attending cinemas, the initial year recorded a 62% attendance rate. Subsequently, there was a gradual upward trend/trajectory, reaching 72% in both 1997 and 1998, with a marginal dip to 70% and a pinnacle at 72% by 2000. Conversely, the frequency of cinema visits experienced a steady decline, commencing at 10.3 and concluding at 8.3.
Examining diverse age categories, cinema attendance displayed considerable fluctuations, with higher popularity observed among younger demographics compared to those aged over 50. The percentage of cinemagoers aged 14 to 25 and 25 to 35 stood at approximately 15%, peaking at around 23% in 1999 before sharply dropping to below 20% by the period's conclusion. Similarly, individuals between 35 and 49 and those over 50 years old began at 12% and 10% in the initial year, reaching the highest/topmost point at around 20% in 1999, but steadily declining to under 15% in 2000.