HomeWriting
The graph shows the number of people taking part in 4 kinds of sports in a particular region between 1985 and 2005
2024-07-22
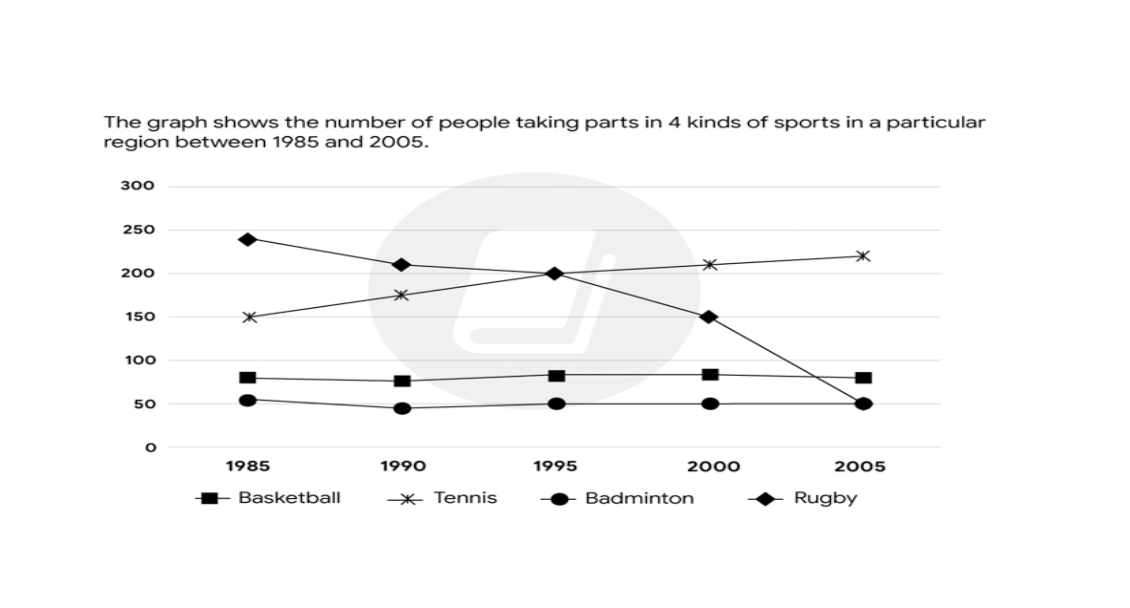
The provided diagram illustrates the sports participation patterns of individuals in an examined region over the period from 1985 to 2005.
Overall, it is evident that the number of residents engaging in rugby exhibited a downward trend, whereas tennis experienced an opposite trajectory, making it the most popular sport in the latter half of the period. Additionally, badminton garnered the least interest. The trends for basketball and badminton remained relatively stable and comparable, with the latter sport consistently being the least favored.
In 1985, the number of rugby players was the highest, reaching 240 members, which was five times the figure for badminton, at 50. Moreover, the data for tennis was 150 participants, which was double that of basketball, peaking at 70.
By 2005, tennis participation had a marginal increase, reaching its zenith at 210, while the opposite trend occurred in rugby. Rugby experienced a substantial decline to approximately 50 participants, precisely four times fewer than tennis. Finally, the participation figures for the remaining sports, including basketball and badminton, remained constant throughout the 20-year period, concluding at just under 100 players.