HomeWriting
The graph and chart below give information on the average daily maximum and minimum temperatures in degrees Celsius (°C) and the average number of days with rainfall each month for two Australian cities
2024-07-26
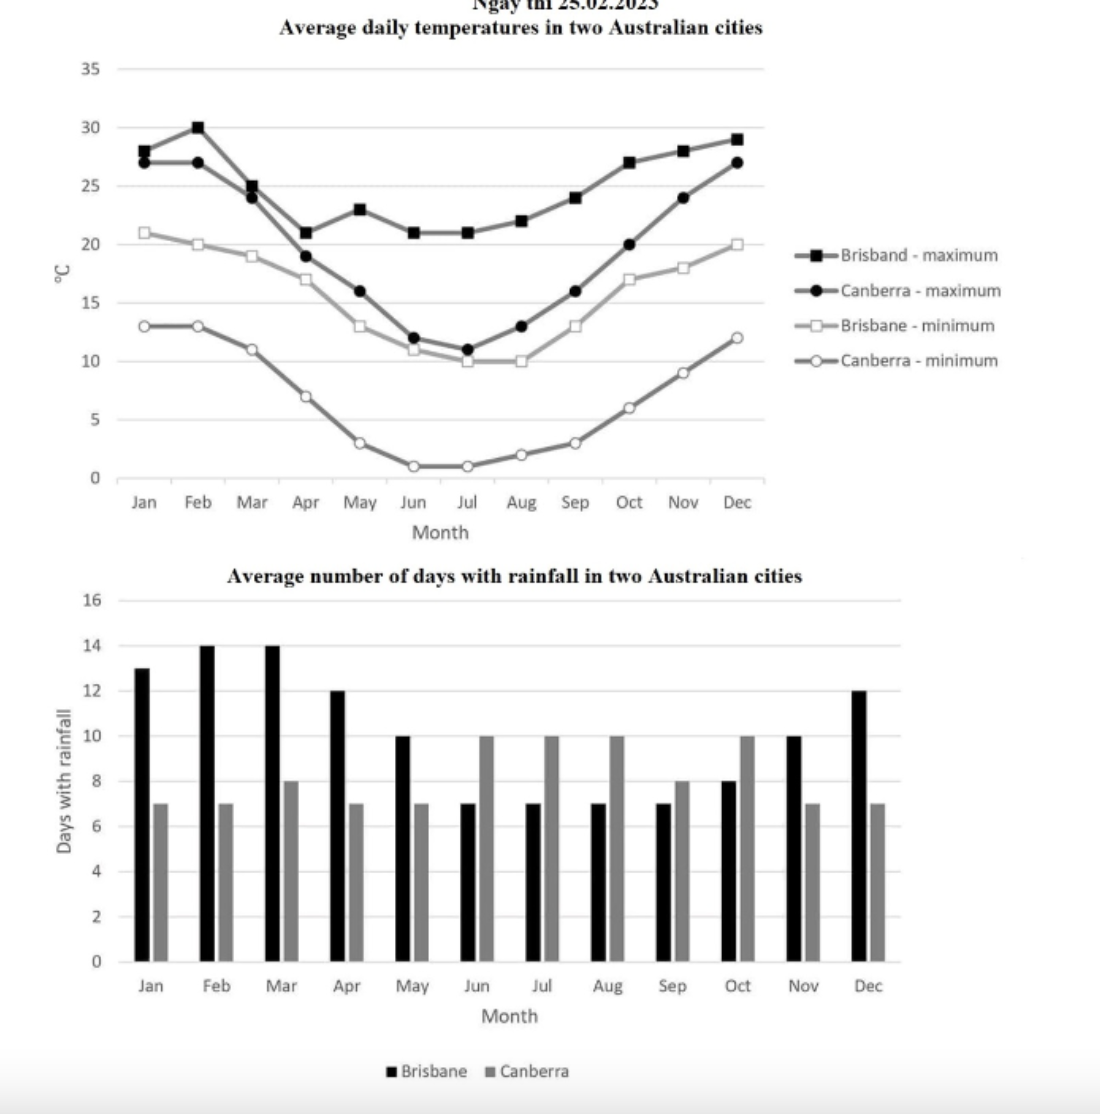
The provided graph and chart illustrate a comparison between the average daily temperatures and the average number of days with rainfall per month in Brisbane and Canberra, Australia.
Overall, the data reveals that Brisbane consistently maintains higher average daily temperatures than Canberra throughout the observed period. Furthermore, the precipitation patterns differ between the two cities, with Brisbane experiencing more substantial rainfall between November and May, while Canberra encounters higher rainfall from June to October.
Examining the line graph, it is evident that Brisbane reaches its peak maximum daily temperature of 30 degrees Celsius in February, subsequently declining to 21 degrees Celsius in April. In contrast, Canberra records its highest temperatures from December to February, with temperatures nearing 27 degrees Celsius. The lowest average daily minimum temperatures occur in both cities in July, registering at 10 degrees Celsius in Brisbane and 1 degree Celsius in Canberra.
Turning attention to the precipitation aspect, Brisbane sees its highest average number of days with rainfall in February and March, totaling 14 days. From June to September, Brisbane experiences approximately 7 days of rainfall, while Canberra encounters 8 to 10 days. Moreover, Canberra maintains an average of 6 days with rainfall throughout the year.