HomeWriting
The chart below shows the results of three surveys on absenteeism in a particular European country in the years 2000, 2005 and 2010. The results show the reasons people gave for not going to work.
2024-07-21
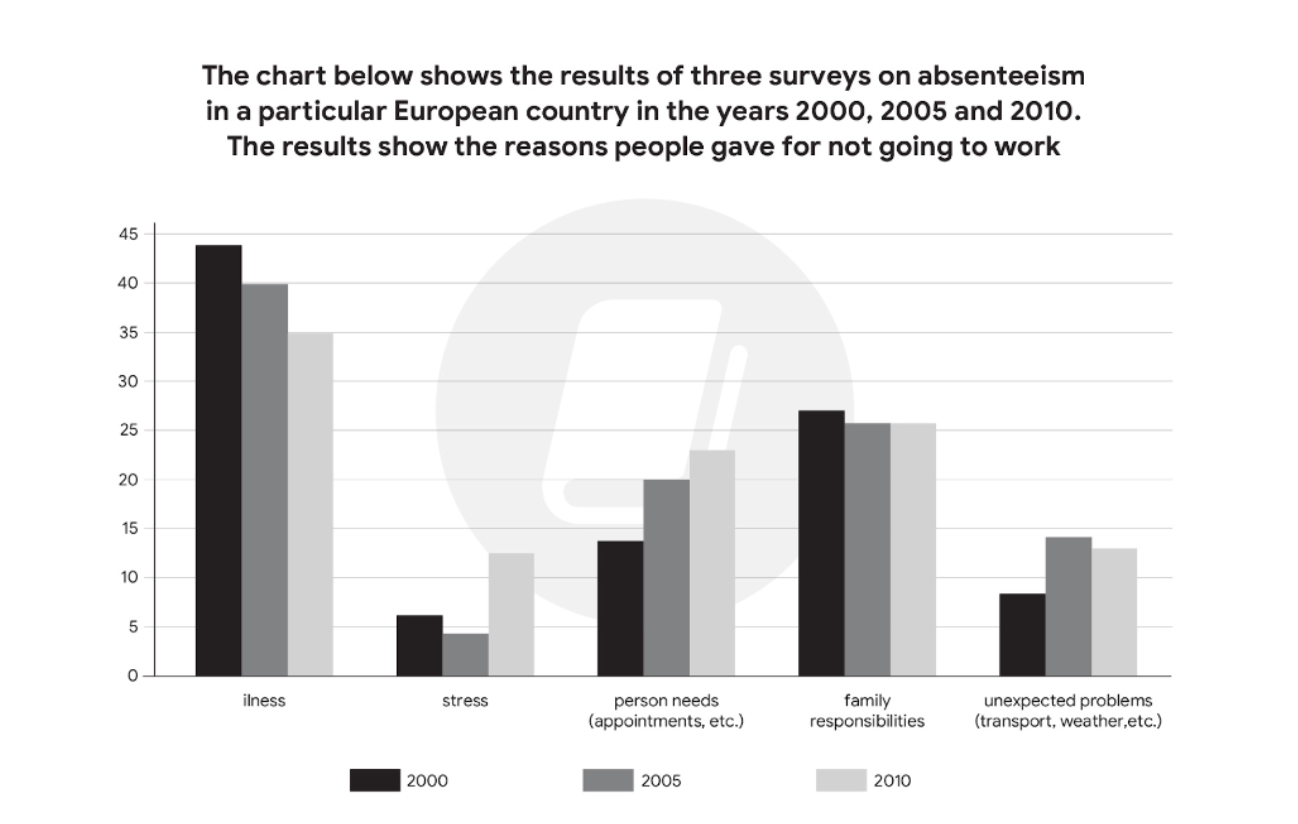
The bar chart illustrates the variations in absenteeism rates for various reasons in a European nation from 2000 to 2010.
Overall, it is apparent that absenteeism due to illness and family responsibilities exhibited a declining trend, while the opposite was observed for reasons related to stress, personal matters, and unexpected problems. Notably, sick leave had the highest rate among employees throughout the surveyed period, with stress being the least common reason.
Examining the bar chart, in 2000, the proportion of absenteeism due to illness was approximately 43%. However, this figure gradually declined to 40% in 2005 and reached exactly 35% in 2010. A similar trend was observed in the rate of leave due to family responsibilities, starting at nearly 26% in 2000 and remaining unchanged at precisely 25% from 2005 to 2010.
In contrast, the trend of employees taking leave due to personal needs increased gradually from around 14% in 2000 to over 23% in 2010. Concerning stress and unexpected problems, their initial figures were both below 10%. By 2010, they stabilized at around 13%, with stress experiencing a slight decrease from above 5%, while unexpected problems saw a considerable rise to nearly 15%.