HomeWriting
The bar chart shows the information of the number of volunteer and paid workers in 4 different roles in the sports sector of an Australian town in 2015
2024-07-22
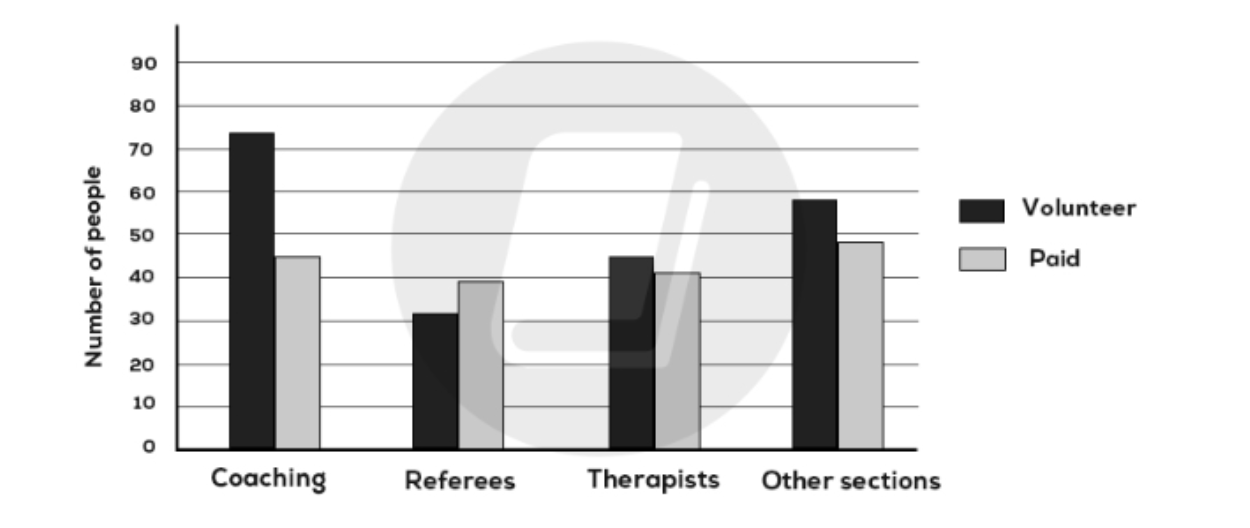
The provided bar chart illustrates the distribution of volunteer and paid staff across four sports-related roles in an Australian town in 2015.
Overall, volunteer staff outnumbered their paid counterparts, with the only exception being in the category of referees. It is also noteworthy that the role of referees, whether volunteers or paid, witnessed the least popularity in 2015.
A detailed analysis reveals that coaching represented the most significant portion of volunteers across all sectors, with nearly 80 individuals volunteering as coaches, doubling the number of paid workers in the same position. In contrast, fewer individuals inclined towards unpaid referee roles compared to those in paid positions, with figures of 30 and 40 people, respectively.
Concerning the remaining roles, the contrast was less pronounced, as seen in the therapists' section and working elsewhere, where the prevalence of volunteering still held true. The participation in volunteer therapist roles was slightly different from the paid positions, with approximately 40 people volunteering. In other sectors, nearly 60 individuals were engaged in volunteer positions, compared to 10 fewer people who were paid for the same job.